Dashboard
The dashboard view allows you to review the overall compliance of a plant. The dashboad displays data from SmartPlant P&ID, SmartPlant Instrumentation or SmartPlant Electical depending on the data that has been imported.
In the dashboard, compliance data is shown graphically using pie and bar charts. Compliance grids display detailed data of the items in the plant and shows the compliance/non-compliance of each item. The interface allows you to browse the results of an Engineering Integrity rule analysis and view the compliance of different groups of items such as piping and instrumentation. For more information on viewing the dashboard see Dashboard View Options
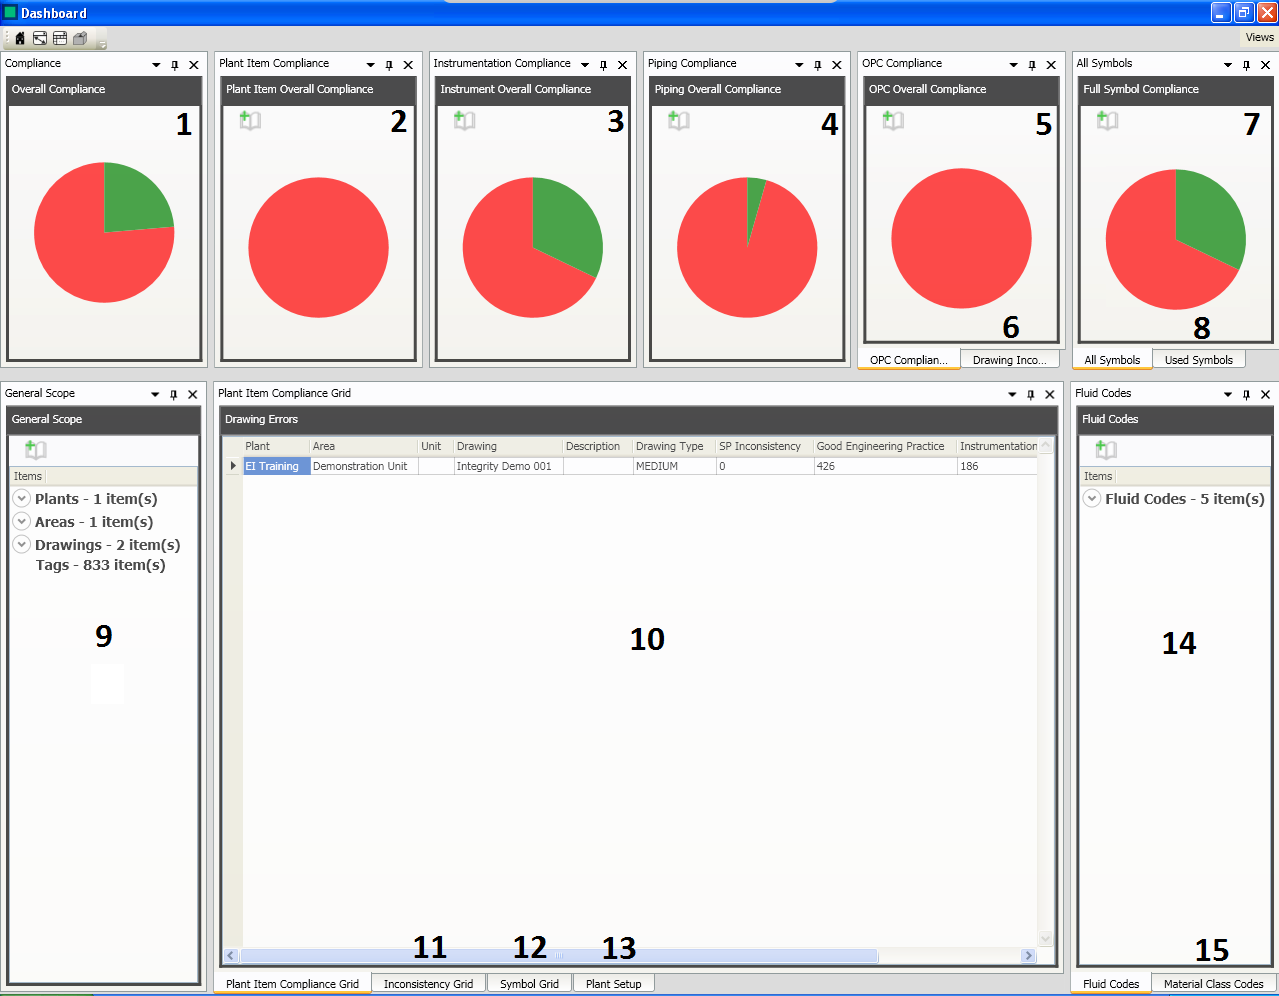
The dashboard is made up of panels:
- Overall compliance panel.
- Plant item compliance panel.
- Instrumentation compliance panel.
- Piping compliance panel.
- OPC compliance panel.
- Selecting this tab will display the Drawing Inconsistencies compliance panel.
- Full symbol compliance panel.
- Selecting this tab will display the used symbols compliance panel.
- This panel displays the General Scope of the analysis. Here you can view which drawings have been used in the analysis and the associated Plant and Area. For more information see Dashboard General Scope.
- The items compliance grid contains the Drawing Name, Equipment Name, Model Type and columns which display the rule types included in the analysis (eg. Design, Drafting and Good Engineering Practices). The compliance grid lists items differently depending on the filter you have selected. For more information on using the complaince grid see Dashboard Compliance Grid and Dashboard Compliance Panels.
- Selecting this tab will display the Inconsistency Grid. This grid lists the inconsistencies in the P&ID. For more information see Dashboard Drawing Inconsistencies.
- Selecting this tab will display the Symbol Grid. This grid lists the symbols in the project. For more information see Dashboard Symbol Compliance Panels.
- Selecting this tab will display the Plant Setup data. For mote information see Dashboard Plant Setup Panel.
- Fluid Codes Panel.
- Selecting this tab will display the Materials class code panel.