Symbol Compliance Panels
There are two Symbol Compliance Panels: All Symbols and Used Symbols.
All symbols displays a comparison of the all the symbol reference data in the model library with the symbol reference data in the plant backup. Symbol name, location (folder structure) and edit history are studied to see if any changes have been made. Symbols which are labelled Addtional, Missing or Modified are deemed non-compliant and Unchanged symbols are deemed compliant.
Used symbols displays a comparison of the symbol reference data in the model library with the symbols present in the project. Again symbol name, location (folder structure) and edit history are studied to see if any changes have been made. Symbols which are labelled Addtional, Missing or Modified are deemed non-compliant and Unchanged symbols are deemed compliant.
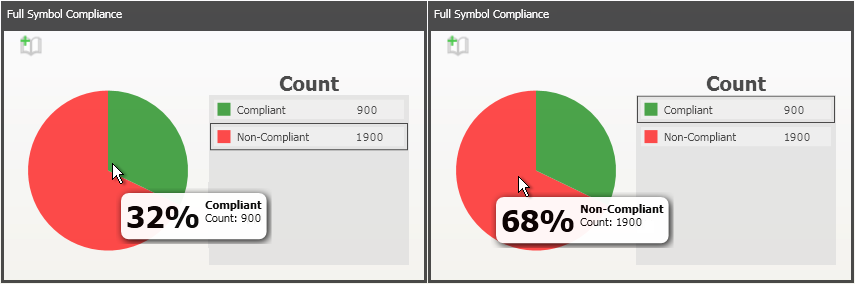
The first time you open the dashboard, this symbol compliance data will be shown in pie charts. The green area of the pie chart represents compliant symbols and the red represents non-compliant symbols. A legend shows the count of compliant and non-compliant items. Hovering the mouse over an area of a pie chart displays a tooltip with a percentage of the total items that are compliant/non-compliant as shown below:
The generate report button ![]() in the corner of the panel allows the user to open the report view of the results.
in the corner of the panel allows the user to open the report view of the results.
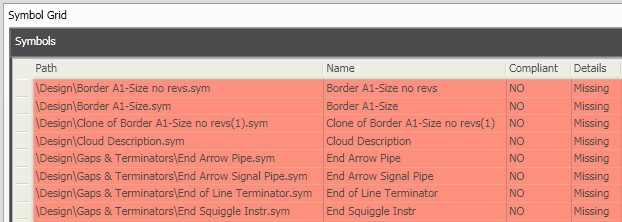
The pie charts allow you to filter the Symbol Grid. For example right clicking the red section of the "Full Symbol Compliance" pie chart and selecting "Filter main" displays the non-compliant symbols in the symbol grid:
The symbol grid displays the symbol path, name, compliance status and the details (Additonal, Missing, Modified or Unchanged).
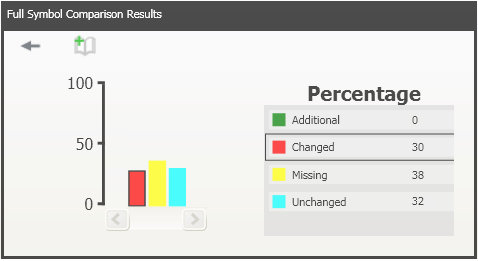
Double clicking anywhere on a pie chart displays a bar chart of the symbols arranged by their details (Additonal, Missing, Modified or Unchanged). For example double clicking the full symbol compliance pie chart shows the following bar chart:
Note: ![]() allows you to go back to view the pie chart
allows you to go back to view the pie chart
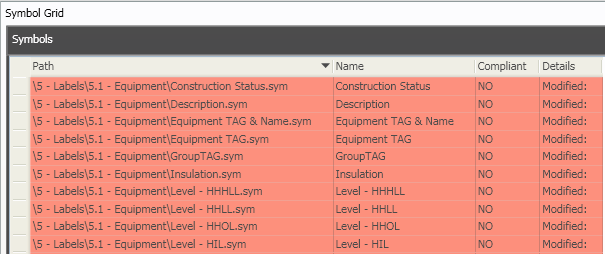
The bar chart allows you to filter the Symbol Grid. For example right clicking the yellow "Missing" bar and selecting "Filter Main" displays the following data in the Symbol grid: