Domain Dashboard
The domain dashboard view allows you to review the overall compliance of a plant. The domain dashboard displays data from SmartPlant P&ID, SmartPlant Instrumentation or SmartPlant Electrical depending on the data that has been imported.
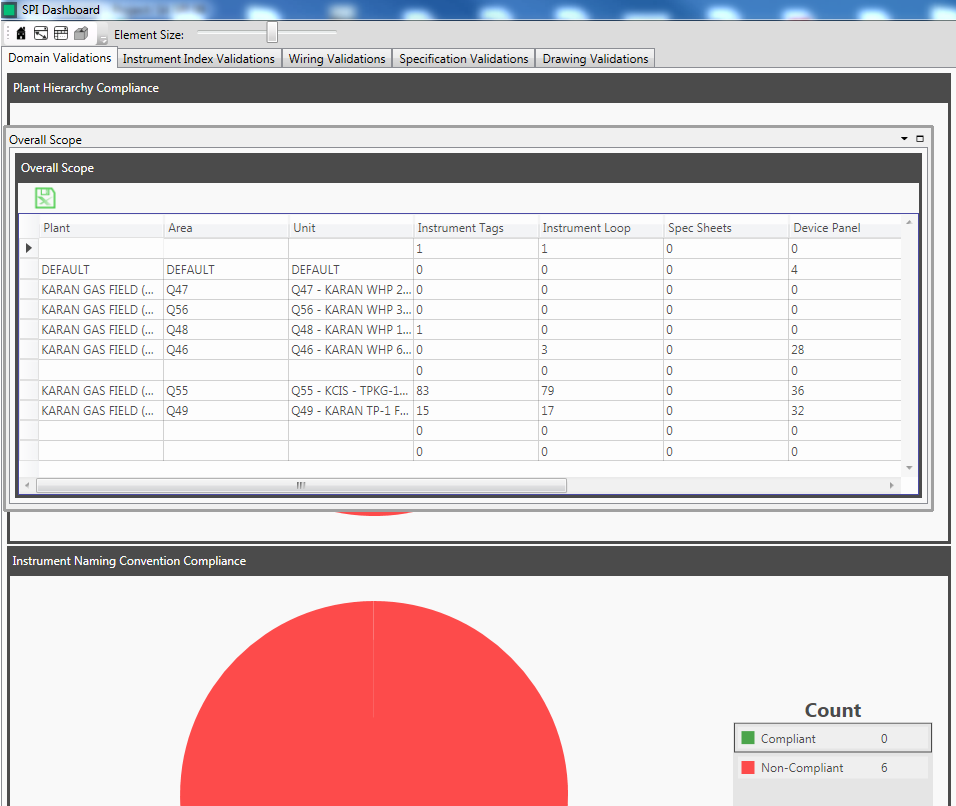
In the domain dashboard, compliance data is shown graphically using pie charts. Compliance grids display detailed data of the items in the plant and shows the compliance/non-compliance of each item. The interface allows you to browse the results of an Engineering Integrity rule analysis and view the compliance of items organised into different custom rule types. For more information on viewing the dashboard see Domain Dashboard View Options.
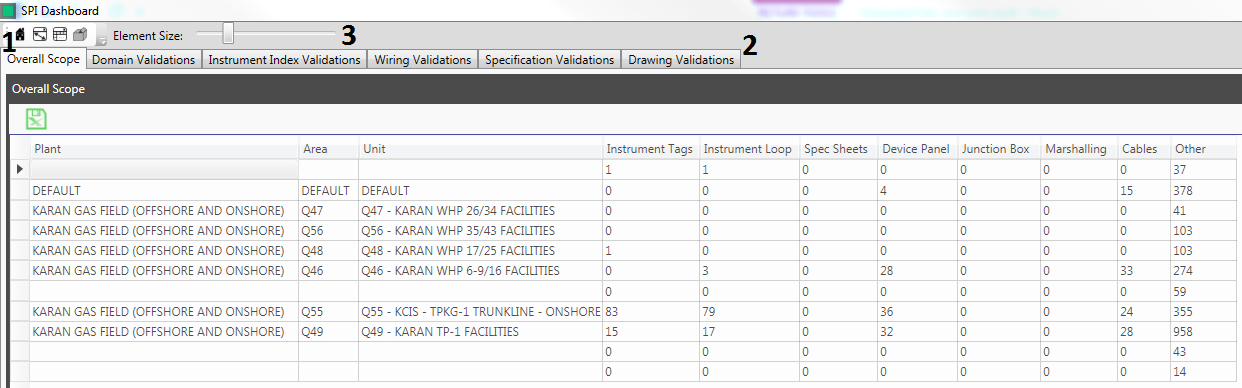
- The Overall Scope Tab displays a grid with a summary of the number of analysed items broken down by Plant, Area and Unit.
- The five Pie Chart Tabs display the pie charts of compliance data arranged by rule type.
- Here the user can adjust the size of the elements displayed in the Pie Chart tabs.
View Options
The Domain Dashboard allows you to review the overall compliance of a plant through a number of compliance panels and compliance grids. The structure of the Dashboard can be rearranged.
Right clicking a tab and selecting "Float" detaches the panel from its position:
Clicking and moving the panel will display a guide diamond used to dock the panels:

You can place the panel in another location by dragging and dropping the panel onto one of the docking guide icons.
The other options available from the panel toolbar are:
Close All But This - Closes all the other panels apart from the tab you have clicked on.
Dock as Tabbed Document - Docks the panel in its current location as a tab
New Horizontal Tab Group - Docks the panel as a tab in a new group with a horizontal orientation.
New Vertical Tab Group - Docks the panel as a tab in a new group with a vertical orientation
There are also viewing option available from the toolbar at the top of the Dashboard:
![]() Selecting the "Home" button removes all filters from the dashboard and reverts the dashboard to the original view.
Selecting the "Home" button removes all filters from the dashboard and reverts the dashboard to the original view.
![]() Selecting "Zoom Main" hides all other panel except from the grid panel
Selecting "Zoom Main" hides all other panel except from the grid panel
![]() Selecting "Show All" reveals all hidden panels
Selecting "Show All" reveals all hidden panels
![]() Selecting "Default Layout" reverts the dashboard structure to its default layout
Selecting "Default Layout" reverts the dashboard structure to its default layout
![]() The "Views" dropdown menu list all of the panels in the dashboard. A will appear next to the panel name if the panel is open. If the panel has been closed then no will appear next to the name.
The "Views" dropdown menu list all of the panels in the dashboard. A will appear next to the panel name if the panel is open. If the panel has been closed then no will appear next to the name.