Drawing Inconsistencies
The dashboard allows you to review drawing inconsistencies using the Inconsistencies Panel and Inconsistency Grid. When the dashboard is first opened the Drawing inconsistencies panel displays a pie chart:

The green area of the pie represents the percentage of the total inconsistencies which have been approved. The red area of the pie represents the percentage of the total inconsistencies which have not been approved. Hovering the mouse over a section of the pie displays a tooltip with the percentage and count. You can right click an area of the pie and select "Filter Main". This will filter the data in the Inconsistency Grid. For example right clicking the red area of the pie and selecting "Filter Main" will filter the Inconsistency Grid so that it only lists inconsistencies which are "Not Approved":
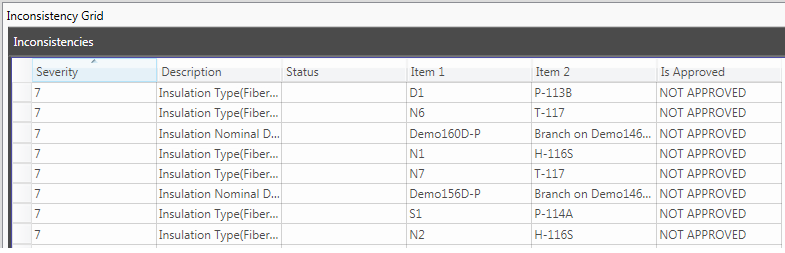
The Inconsistency Grid lists the Severity, Description, Status, Items related to the inconsistency and the approval status of each inconsistency.
To view a bar chart of the inconsistencies arranged by Severity, double click the red or green section of the pie. Selecting the green section of the pie will show a bar chart of only the approved inconsistencies arranged by severity. The bars display the percentage of the total inconsistencies in each Severity which are approved:

Selecting the red section of the pie will show a bar chart of only the not approved inconsistencies arranged by severity. The bars display the percentage of the total inconsistencies in each Severity which are not approved:

Right clicking a bar and selecting "Filter Main" filters the Inconsistency grid to only show the Approved/Not Approved inconsistencies of a particular Severity.