Compliance Panel
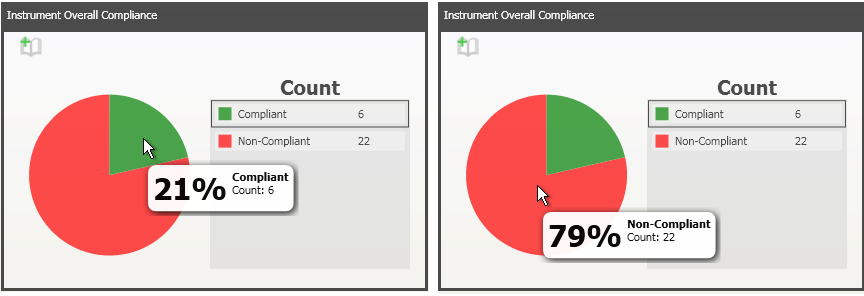
The Compliance Panels can display Pie, Bar and Line charts of different item types such as plant items, instruments and piping. The first time you open the dashboard, you will see a number of pie charts. The green area of the pie chart represents compliant items and the red represents non-compliant items. A legend shows the count of compliant and non-compliant items. Hovering the mouse over an area of a pie chart displays a tooltip with a percentage of the total items that are compliant/non-compliant as shown below. Items are deemed Compliant/Non-Compliant based on the rule type compliance threshold set when creating rule types. For more information see Custom Type Editor.
The generate report button ![]() in the corner of the panel allows the user to open the report view of the results.
in the corner of the panel allows the user to open the report view of the results.
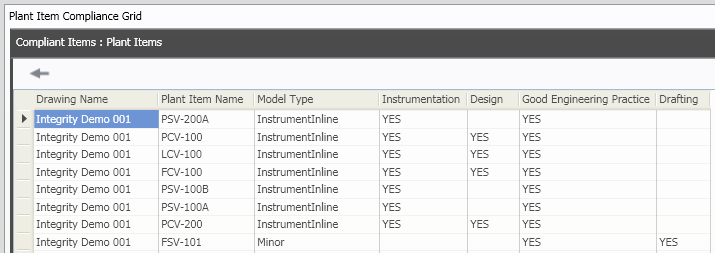
The pie chart allows you to filter the data in the Dashboard Compliance Grid. For example right clicking the green section of the "Instrument Overall Compliance" pie and selecting "Filter main" displays the following data in the compliance grid. Now the compliance grid displays the compliant instruments and their relevant rule types:
Similarly, right clicking the red section of the "Instrument Overall Compliance" pie and selecting "Filter main" displays the non-compliant instruments and their relevant rule types.
Double clicking anywhere on the pie chart displays a bar chart. This bar chart will display different data depending on the Dashboard settings you have chosen. For more information on editing the dashboard see Dashboard Setup.
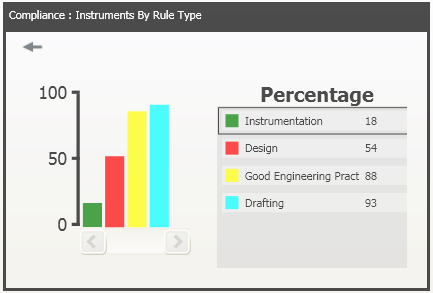
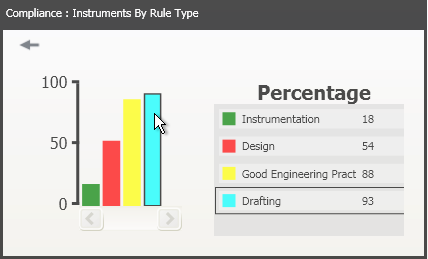
The default setting for all dashboard compliance panels is to display a bar chart with items arranged by rule type. For example double clicking the "Instrument Overall Compliance" pie chart displays the following bar chart:
Note: ![]() allows you to go back to view the pie chart.
allows you to go back to view the pie chart.
The bar chart displays the percentage of compliant items in each rule type. Right clicking a bar displays three filtering options: Filter Main, Filter Main (show only compliant), Filter Main (show only non-compliant). Here you can chose to filter the compliance grid. For example right clicking the "Instrumentation" bar and selecting "Filter Main" displays the following data in the compliance grid:
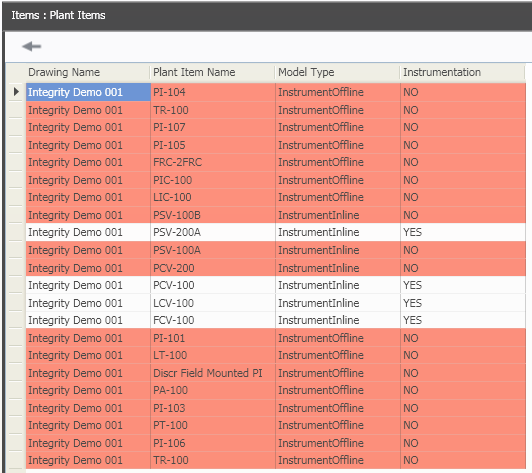
If a cell contains the word "YES" then the item is compliant for that particular rule type. If a cell contains the word "NO" then the item is not compliant for that particular rule type. The row containing the non-compliant item will also highlighted in red.
If Filter Main (show only compliant) was selected the compliance grid would only display the four compliant items If Filter Main (show only non-compliant) was selected then the compliance grid would only display the eighteen non-compliant items.
You can chose to display another bar chart which arranges the items in a rule type by model type /rule group.
The default setting for the plant item, instrument, piping and OPC dashboard compliance panels displays a bar chart of items arranged by model type. However, the default setting for the Overall Complaince panel displays a bare chart of items arranged by rule group. These default settings can be edited. For more information on editing the dashbord see Dashboard Setup.
To display a second bar chart, double click on a bar. For example the "Instruments By Rule Type" bar chart:
Selecting the blue "Drafting" bar in the above snapshot displays a bar chart of the items in the "Drafting" rule type arranged by model type:

Here the bar chart shows the percentage of compliant items in each model type. If you right click on a bar the three filtering options are displayed: Filter Main, Filter Main (show only compliant), Filter Main (show only non-compliant). Here you can chose how you want to filter the compliance grid.