Pie Chart Tabs
The Pie Chart Tabs display compliance data of items in particular rule types. The rule types are grouped together in five pie chart tabs and can be found at the top of the dashboard:
![]()
Domain Validations - In this tab the user will find pie charts representing five rule types: Plant Hierarchy, Instrument Naming Convention, Loop Naming Convention, Custom Tables and Custom Fields for Different Tables
Instrument Index Validations - In this tab the user will find pie charts representing four rule types: Instrument Index Tables, Instrument Index P&ID Tables, Instrument Tags and Loops
Writing Validations - In this tab the user will find pie charts representing three rule types: Wiring Tables, Panels and Cables
Specification Validations - In this tab the user will find pie charts representing three rule types: Specification Forms, Unit of Measure and Specification Sheets
Drawing Validations - In this tab the user will find pie charts representing eight rule types: Title Block, Drawings Layout, ISS Drawings, ILD Drawings, ISD Drawings, IIS Drawings, CCS Drawings and ECD Drawings
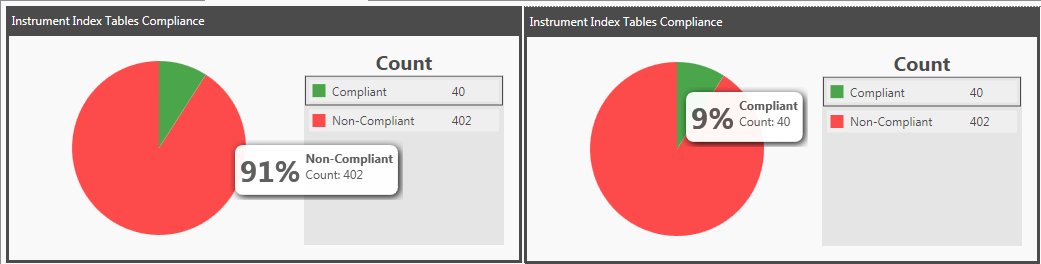
The green area of the pie chart represents compliant symbols and the red represents non-compliant symbols. A legend shows the count of compliant and non-compliant items relating to the particular rule type. Hovering the mouse over an area of a pie chart displays a tooltip with a percentage of the total items that are compliant/non-compliant as shown below. Items are deemed Compliant/Non-Compliant based on the rule type compliance threshold set when creating rule types. For more information see Custom Type Editor.
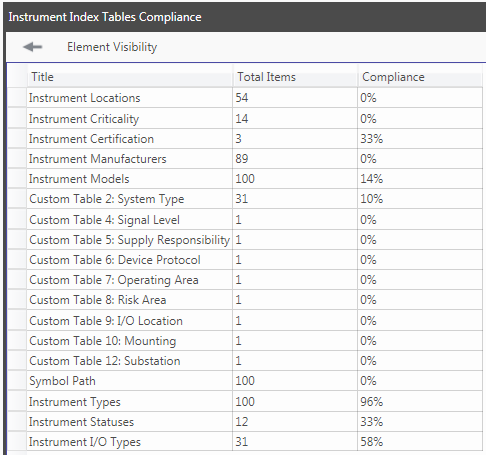
Double clicking the "Instrument Index Tables Compliance" pie chart displays a grid of the rule groups in that particular rule type along with a count of the total items in the group and the compliance percentage:
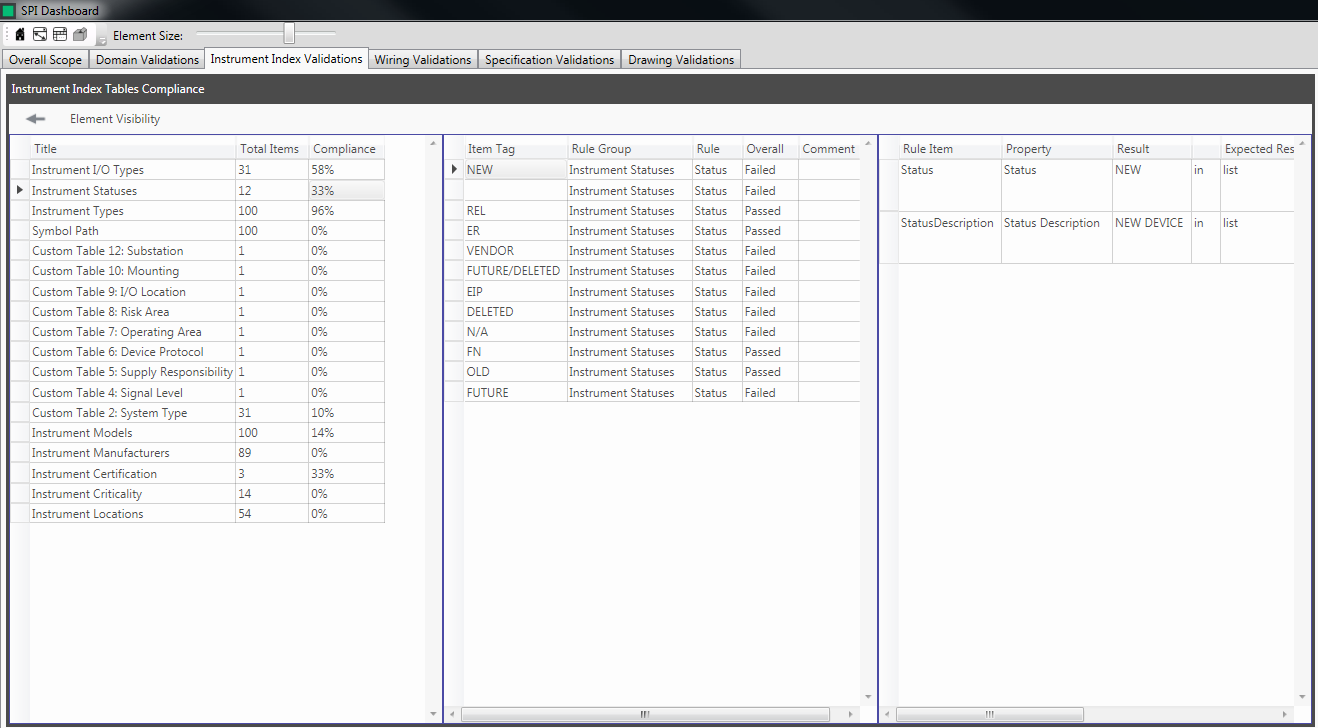
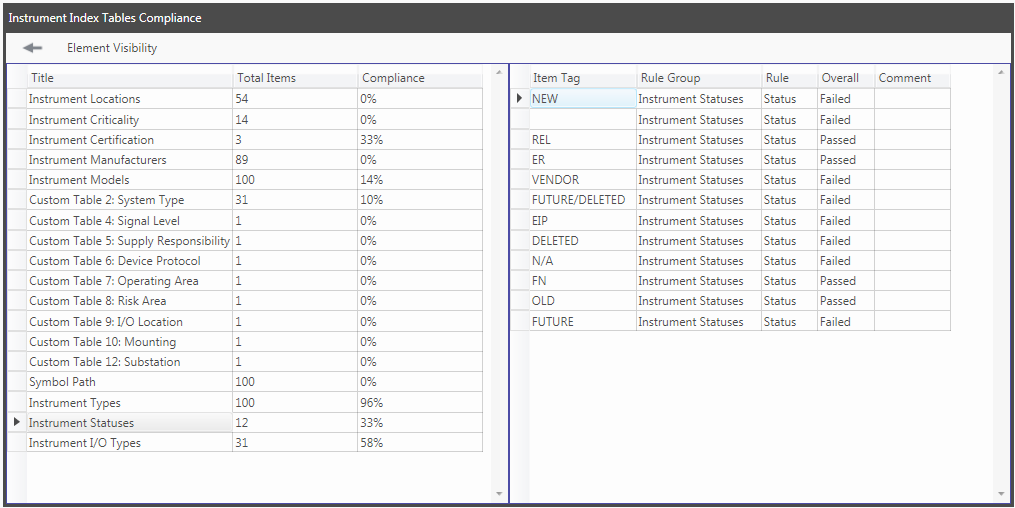
Double clicking on a cell displays the specific items along with their rule group, rule name, overall result and comment. This data is shown in an additional grid alongside the rule group grid:
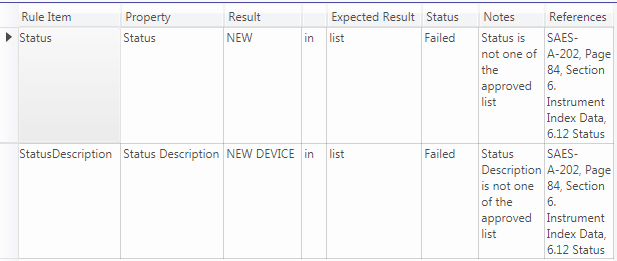
Double clicking on a "Passed" or "Failed" cell displays the detailed rule result in an additional grid. The grid displays each rule item in the rule along with the Property, Result, Expected Result, Status, Notes and References:
The Element Size slider at the top of the dashboard can be used to adjust the size of the grids: