SAFE Results
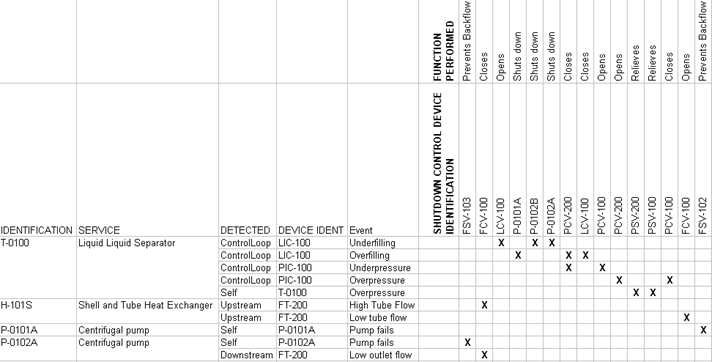
The SAFE Results take the form of a SAFE Chart which displays the major items on a P&ID and the safety systems in place to prevent or mitigate an event. An example of a SAFE chart is shown below:
It is possible to highlight the major item by right clicking a ![]() and selecting "highlight".
and selecting "highlight".
A toolbar at the top of the form displays the following options:
 Allows you to browse previous SAFE Results
 Turns on automatic highlight
 Allows you to export the chart to an excel document