SIL Graph Structure
The SIL Graph Structure Panel is where the Administrator defines the Structure of the SIL Graph to be used in required SIL Specification in the Hazop Analysis.
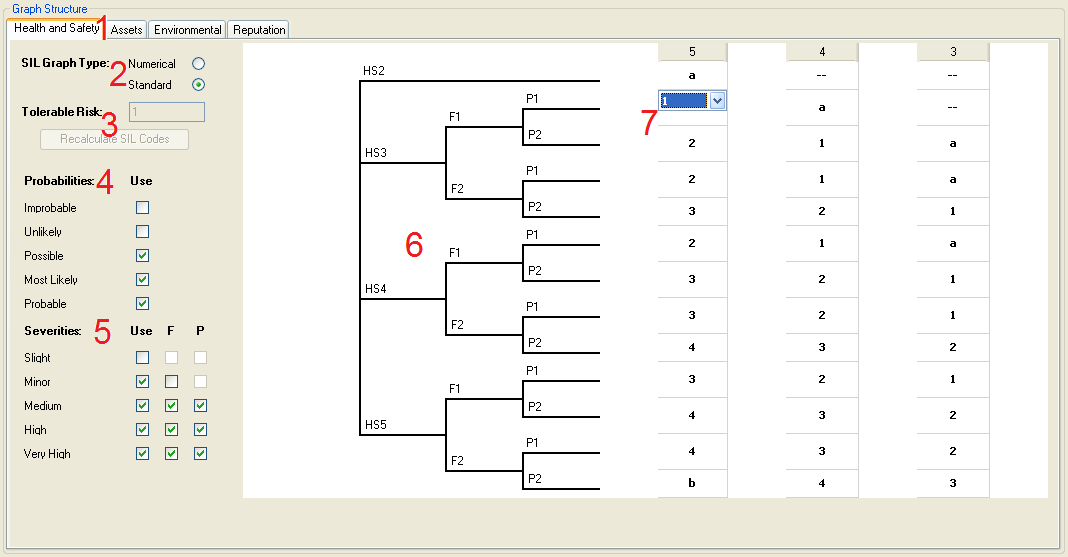
The SIL Graph Setup Menu can be split in to Seven Sections:
- The Graph Tabs - These show the Graph for each Risk Category Defined in the specified Risk Matrix.
- The SIL Graph Type - The Administrator selects the SIL Graph type using the Radio Buttons.
- The Tolerable Risk definition - The Administrator defines the value for Tolerable Risk here, the "Recalculate SIL Codes" button is used to recalibrate the SIL Graph.
- The Probability Selection - Here the Administrator selects which probabilities should be included in the SIL Graph using the check boxes.
- The Severity Selection - Here the Administrator selects which severities should be included in the SIL Graph using the check boxes. The F and P check boxes are used to include the additional SIL Graph Options for Frequency of Occupancy of Workers in the Affected Area, and Probability that Workers in the Affected Area can Safely Egress and Avoid the Hazard.
- The SIL Graph - This is automatically generated based upon the selections made in points 4 and 5.
- The Required SIL Selection - The Administrator selects the Required SIL for each of the applicable Probability and Severity Criteria here.