Adding a Risk Category
SIL Graphs are a method used to determine the required SIL of Cause-Consequences within the HAZID Framework Process Safety Product and are created by clicking on the ![]() button, this opens the SIL Graph Setup Menu. Selecting a SIL Graph and clicking on the
button, this opens the SIL Graph Setup Menu. Selecting a SIL Graph and clicking on the ![]() button will open the SIL Graph Menu for the selected Graph. Note that a previously created SIL Graph has been used for the purposes of this guide.
button will open the SIL Graph Menu for the selected Graph. Note that a previously created SIL Graph has been used for the purposes of this guide.
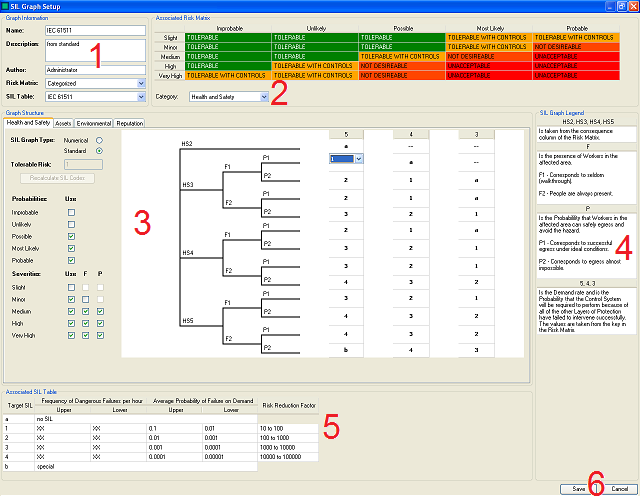
The SIL Graph Setup Menu can be split in to Six Sections:
- The Graph Information - The Administrator enters general information about the SIL Graph here.
- The Associated Risk Matrix - The Administrator can view the Risk Matrix Associated with the SIL Graph here.
- The Graph Structure - The Administrator defines the structure of the graph and the SIL rankings here.
- The SIL Graph Legend - Useful information pertaining the the graph is displayed here.
- The Associated SIL Table - The Administrator can view the SIL Table Associated with the SIL Graph here.
- The Administrator can Save the SIL Graph Using the Save button or Cancel saving the SIL Graph/Abandon any changes made to an existing SIL Graph Using the Cancel button.
The ![]() button is used to quickly delete a SIL Graph. However, deleted SIL Graphs are not removed from the database, and can be restored by selecting them and clicking on the
button is used to quickly delete a SIL Graph. However, deleted SIL Graphs are not removed from the database, and can be restored by selecting them and clicking on the ![]() button.
button.
The ![]() button allows the Administrator to import a SIL Graph from an existing Hazop study.
button allows the Administrator to import a SIL Graph from an existing Hazop study.